Most students would argue that they prefer an easy course over a challenging one. But does the data actually support this intuition? This article analyzes around one thousand course evaluations from the UMCG/FEB to investigate the relationship between course enjoyment and workload. The data is sourced from De Zwoegfactor, a growing platform and essential study tool that provides personalized academic advice based on student experiences.
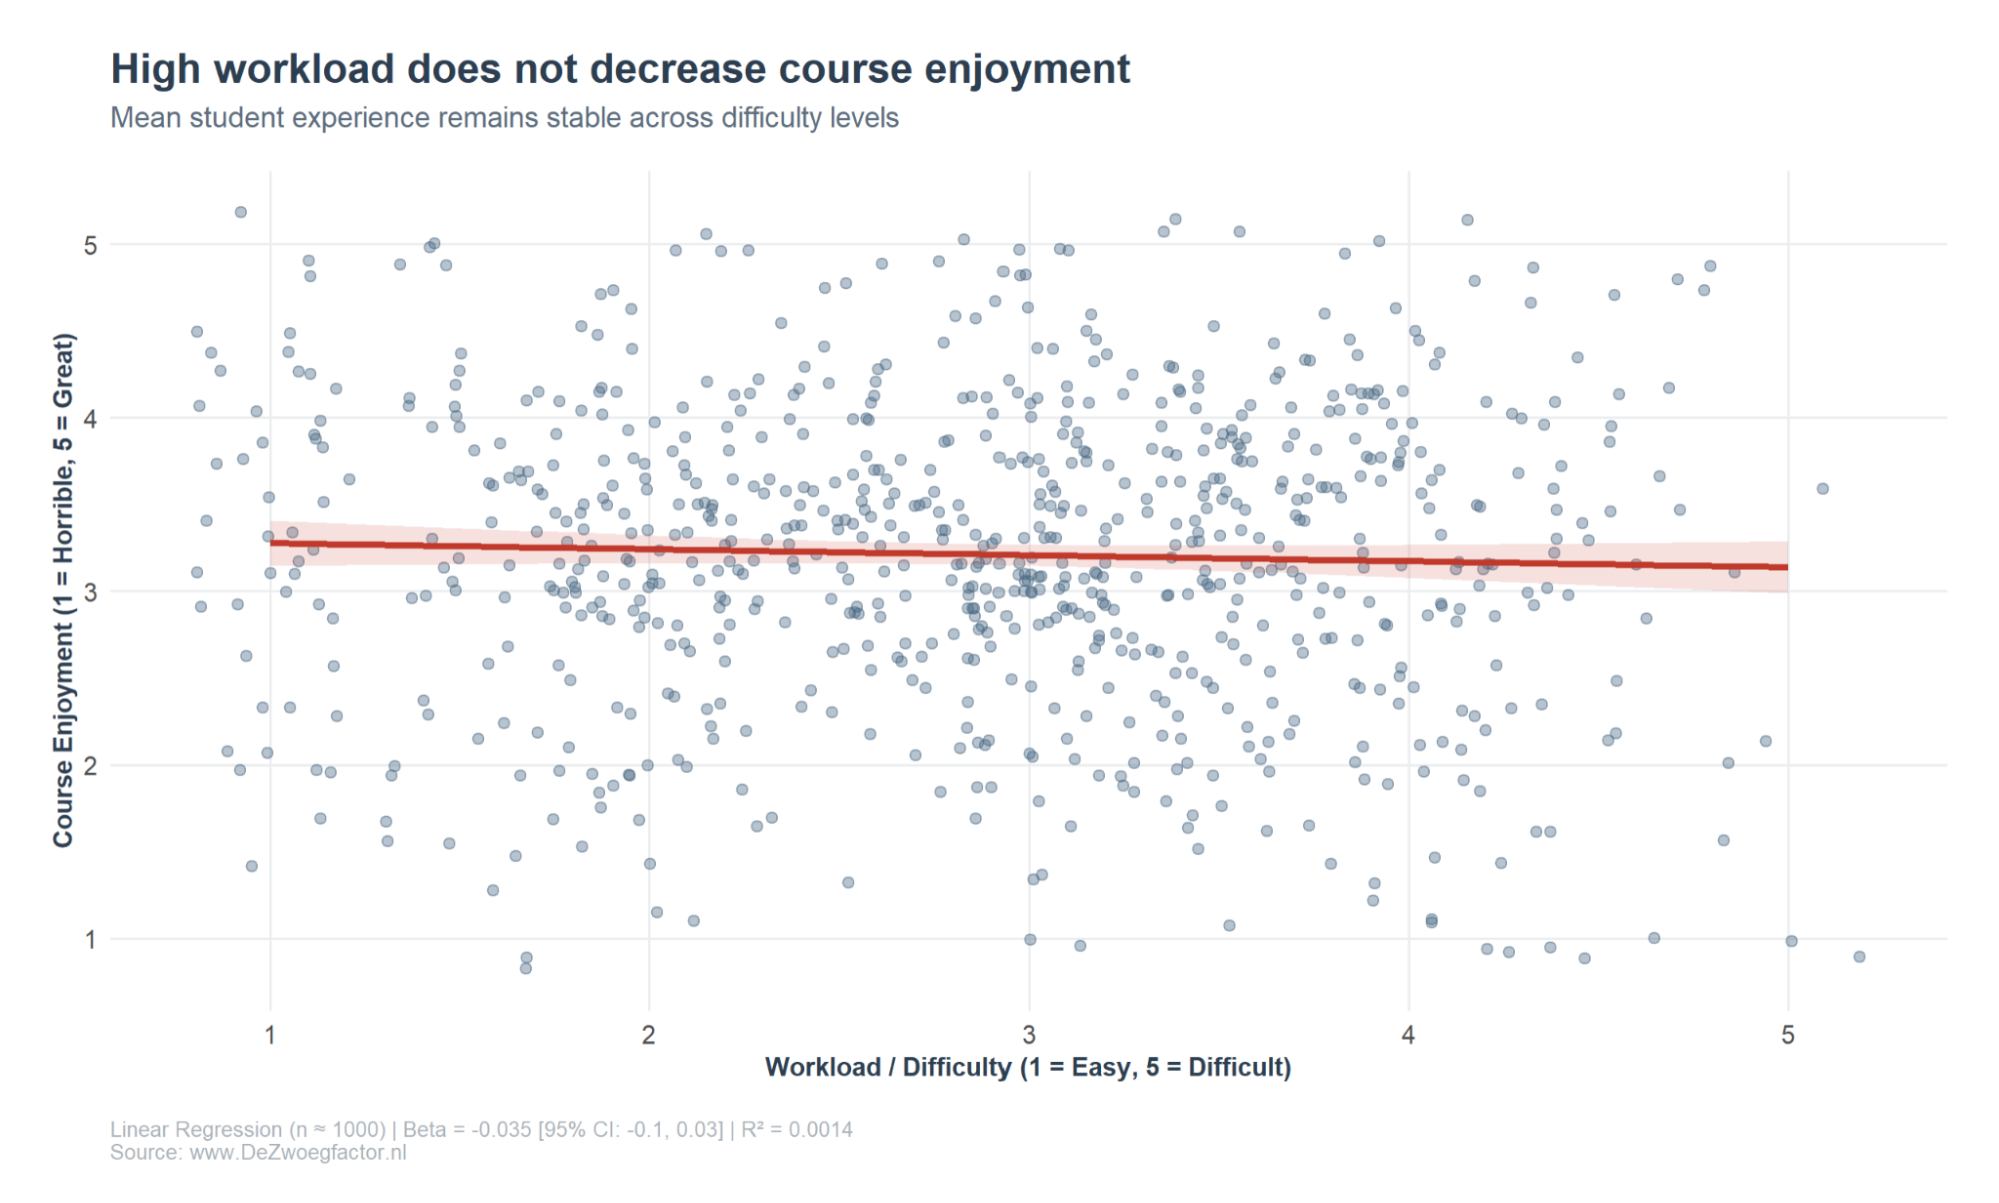
The analysis begins with a linear regression on the data. The results, as shown in the figure below, reveal that the slope coefficient is not significantly different from zero. Furthermore, the R2 is less than 1 percent, meaning that course difficulty explains less than 1 percent of the variance in student enjoyment. Based on this initial analysis, one might conclude that workload does not affect the student experience at all, but that conclusion would be premature.
By dividing the courses into three categories, easy, average, and tough, and calculating descriptive statistics for each in the table below; an interesting pattern emerges. The means are remarkably similar, while the standard error for tough courses is higher due to a smaller sample size. The most striking observation is the variance. The variance for tough courses seems to be 23% and 38% higher than for easy and average courses respectively.
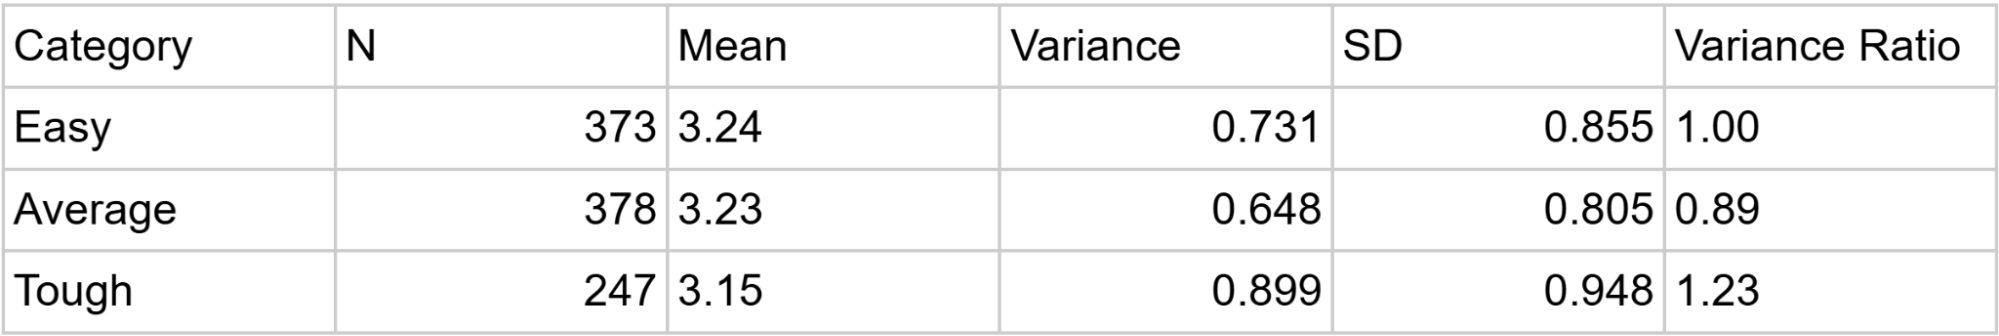
This suggests that difficult courses are perceived in much more extreme ways. A high-workload course is more likely to be experienced as either very poor or very enjoyable. This could be because a tough course can be perceived as tedious and unrewarding, or conversely, as challenging yet highly interesting and educational.
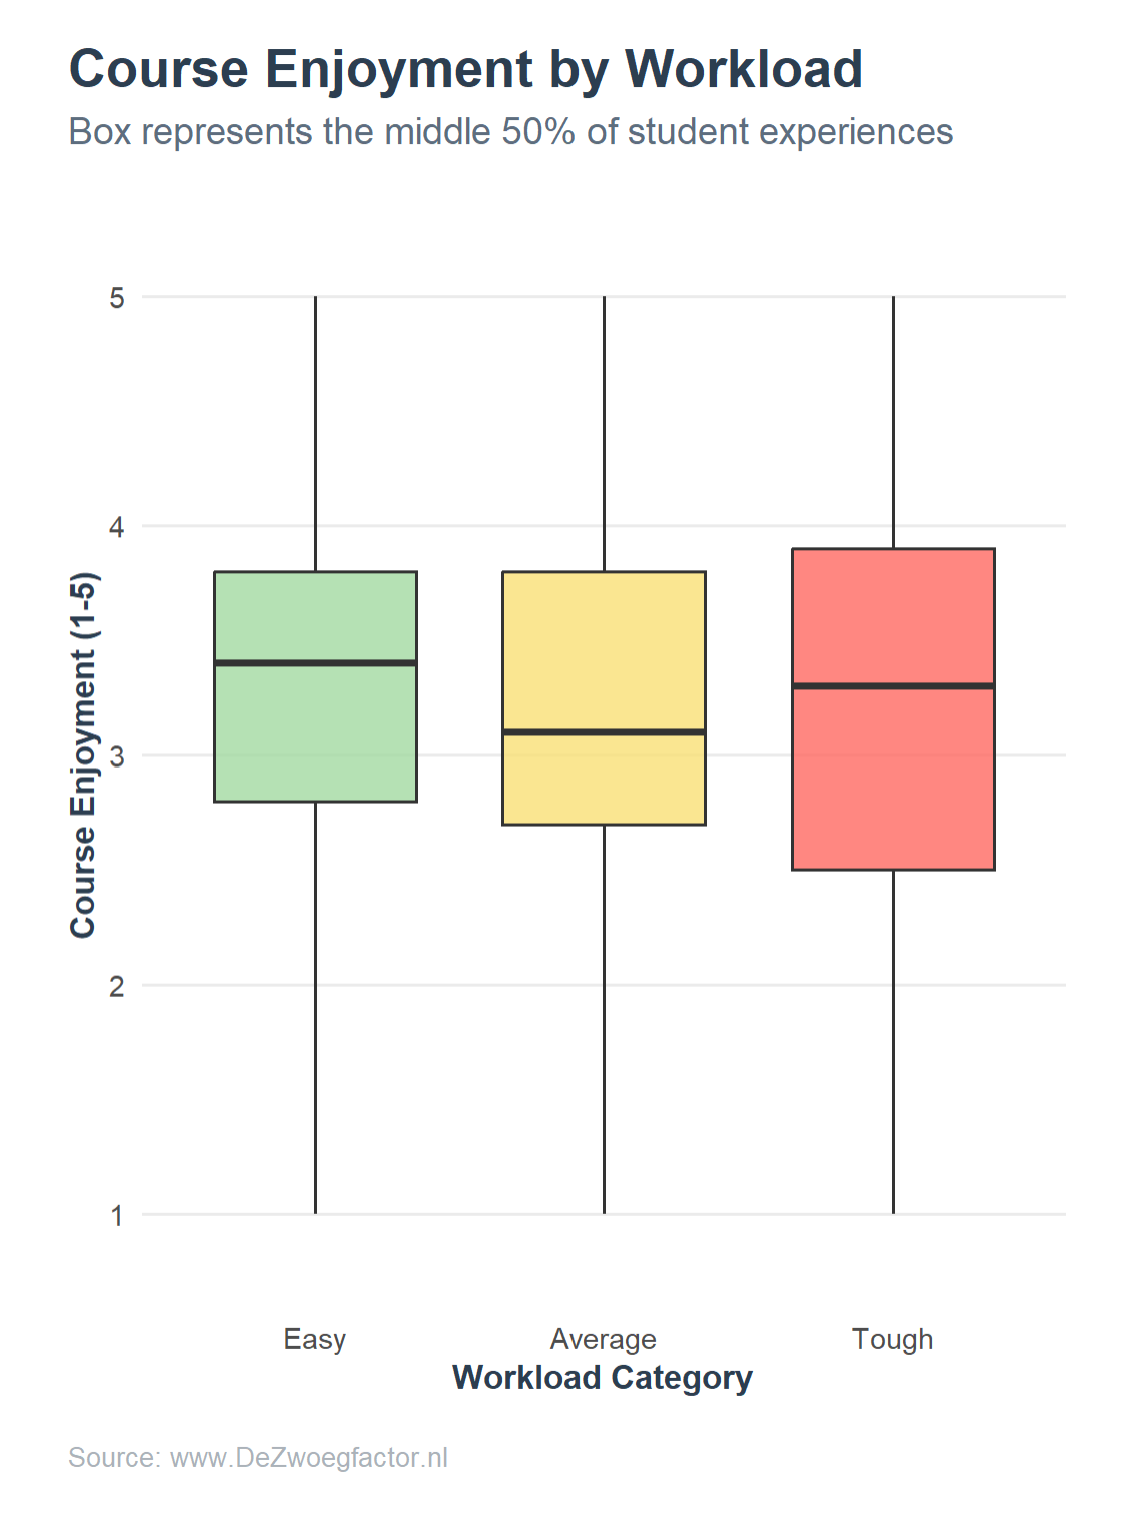
This pattern is also reflected in the boxplot below, where the box for tough courses is considerably wider than those for easy and average courses. This shows that student experiences in high-workload courses are much more spread out, indicating a higher degree of volatility.
To formally test these suspicions of heteroskedasticity, a Levene’s test was performed. The test yielded a p-value of 0.019, indicating a significant difference in variance across the groups. Subsequently, a Tukey post-hoc test was conducted to examine differences in spread between the categories. This revealed no significant difference between ‘Easy’ and ‘Average’ courses (p = 0.51). However, the difference between ‘Average’ and ‘Tough’ courses was highly significant (p = 0.0067), indicating that the variance differs significantly even at the 1% level. These results suggest that the observed increase in volatility is not coincidental and that average ratings alone do not capture the full picture.
In conclusion, difficult courses are 'high risk, high reward.' They have a higher probability of being experienced as exceptionally enjoyable, but also a much higher risk of being perceived as terrible. These findings highlight the necessity of a tool like De Zwoegfactor. Instead of relying on generic course descriptions or vague advice from older students, De Zwoegfactor calculates how you will likely experience a course based on your own historical ratings.
This allows you to discover whether you are part of the group that thrives on the challenges the course offers, or if you would be better off choosing a different elective. Furthermore, De Zwoegfactor is the only independent source for specific tips on lectures, literature, exams, and assignments.
Check your personalized study advice now at www.dezwoegfactor.nl!