A striker runs toward goal, receives a cross from his winger, takes a great first touch, and dribbles past the goalkeeper. Just before shooting, however, he missteps and the ball goes wide: no goal. Later in the match, a midfielder takes a gamble and shoots from 30 meters out, and the ball goes in. Which chance was “better”? In modern football analytics, this question is answered with a single number: expected goals, or xG. Behind this widely used but seemingly simple metric lies a classic econometric model. But how is this probability actually estimated?
Expected goals, or xG, assigns a probability to each shot based on how likely it is to result in a goal. For example, a shot taken from short range with no defenders nearby will typically receive a higher xG than a shot taken from outside of the penalty area. In this way, xG provides a more insightful statistical measure of the quality of chance than simply counting goals. But how are these probabilities actually determined? From a statistical perspective, each shot can be seen as a binary outcome: it either results in a goal or it does not. This naturally leads to an econometric framework designed to model such outcomes.
A naive approach might be to use a linear regression, relating the probability of scoring to variables such as distance or angle. However, this quickly leads to problems as the predicted value can lie outside the interval (0,1) which makes little sense in practice. Moreover, the relationship between chance characteristics and xG is non-linear. For example, moving from 5 to 10 meters away from goal has a much larger impact than moving from 25 to 30 meters from goal. To address this, xG models typically rely on logistic regression. This model transforms a linear combination of explanatory variables into a probability that always lies in the interval (0,1).

In this framework, each coefficient captures how a specific variable affects the likelihood of scoring. The model is estimated using historical data. By observing thousands of past shots and their outcomes, the model learns which characteristics are associated with higher or lower scoring probabilities. In this sense, xG is not based on subjective judgement, but on patterns in the data.
While the logistic regression framework provides the structure, the quality of an xG model ultimately depends on the variables and data included in the model. One of the most important factors is distance to goal. Shots taken closer to the goal are more likely to score, which is reflected in a strong negative relationship between distance and scoring probability. Closely related is the angle to goal: attempts taken from a central position are generally more dangerous than shots from tight angles near the sidelines. In addition to location, the type of chance also matters. For example, a shot following from a through ball or a cutback is often more dangerous than a shot from a static position, as the defence may be less organized. Similarly, the body part used can influence the likelihood of scoring: headers, for instance, tend to have lower success rates than shots taken with the foot.
More advanced models attempt to incorporate additional context, such as whether the shooter is under pressure or the positioning of defenders and the goalkeeper. However, such detailed data is often not publicly available. As a result, many practical implementations of xG rely primarily on observable characteristics such as shot distance and angle. Even relatively simple models using only a few key variables can already provide useful estimates of scoring probability. This highlights a common theme in econometrics: while adding more variables can improve a model, a small number of well-chosen predictors often capture a large share of the underlying variation.
A Simple Empirical Illustration
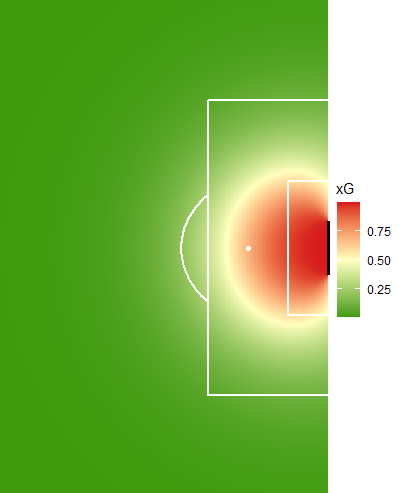
To illustrate how an xG model works in practice, shot locations can be generated across the attacking half of the pitch. For each location, the distance and angle to goal are calculated and inserted into a simple logistic model. The resulting predictions are visualised in a heatmap. Each point on the pitch is assigned an xG value, with red colors indicating a higher probability of scoring. The model is specified such that shots taken closer to goal and from more central positions receive higher probabilities, while long-distance or wide-angle shots are assigned lower xG values.
Returning to the opening example, the first chance would receive a much higher xG value than the long-distance goal, despite not resulting in a score. This highlights a key insight: outcomes in football are noisy, and goals alone do not fully reflect chance quality. Expected goals address this by assigning probabilities to shots, providing a more consistent measure of performance. At its core, xG is simply an application of a standard econometric model to a sporting context. In doing so, it shows how even simple econometric tools can bring structure to complex, uncertain environments, without taking away the unpredictability that makes football so engaging.